The Ledger
Markets. Income. Risk. Opportunity.
An investor memo from The Freedom Arch covering macro, options income, portfolio strategy, risk management, and the setups I’m watching.
Not financial advice.
October 12, 2026
Rates, Earnings, and What has to happen next…
I’ve spent a lot of time recently talking about the 10-year Treasury yield, market breadth, and why I’ve become more selective with risk. At some point, repeating that yields are high stops adding much value. What matters now is what the market does with them.
That is where I think things are getting interesting.
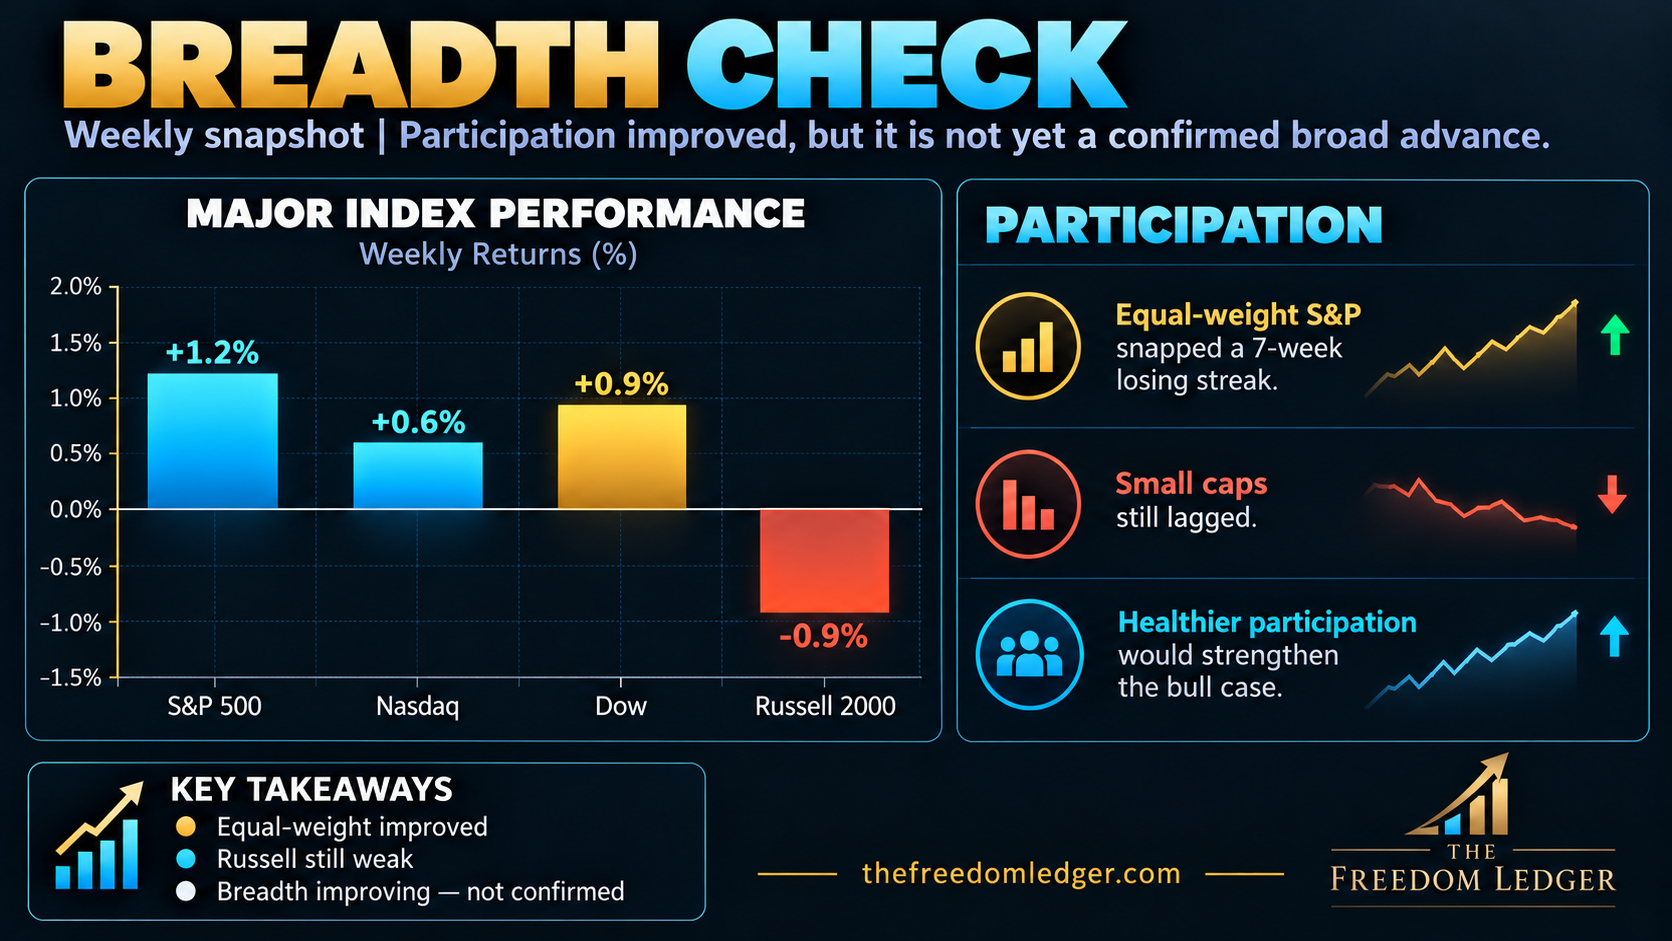
The S&P 500 finished last week higher again, gaining roughly 1.2%, while the Dow and Nasdaq also advanced. More importantly, equal-weight participation finally improved after seven consecutive weeks of weakness. It’s only one week, and the Russell 2000 still declined, so I’m nowhere near calling this a broad-based breakout. But it was the first real sign in a while that participation underneath the index may be trying to improve.
At the same time, the biggest headwind facing stocks finally gave the market a little breathing room. The 10-year Treasury yield pushed to roughly 5.37% during the week before finishing near 5.24%. That is still an incredibly restrictive level, but the direction matters. Stocks have spent months absorbing higher long-term rates. Even a small pause in that pressure could be enough to allow the underlying earnings story to take control again.
That is really the setup I’m watching over the next several weeks.
I don’t think the market necessarily needs the 10-year to collapse back toward 4%. I do think it needs rates to stop accelerating higher. If that happens while forward earnings continue growing, the S&P looks increasingly capable of another leg up.
The catch is that earnings now have to do more of the work.
1. The 10-Year Has Become the Market’s Pressure Valve
For most of the last several years, investors have been conditioned to focus almost exclusively on the Federal Reserve. Every inflation report became a debate about the next Fed meeting. Every employment report was immediately converted into probabilities for another hike, a pause, or an eventual cut.
That still matters, but I think the more important number for equity investors right now sits farther out on the curve.
The 10-year Treasury yield has become one of the clearest pressure points for this market.
The Fed can stop raising short-term rates and financial conditions can still tighten if longer-term yields continue moving higher. That affects mortgage rates, corporate borrowing costs, commercial real estate, consumer credit, business investment and, ultimately, the valuation investors are willing to place on future corporate earnings.
At approximately 5.24%, the 10-year is no longer background noise. Real yields are approaching 3%, meaning investors can earn a historically attractive inflation-adjusted return from government bonds without taking equity risk.
When Treasury yields were 1% or 2%, the argument for owning equities was relatively easy. Investors searching for meaningful returns had very few alternatives. At more than 5%, the calculation changes. Cash and fixed income are no longer simply places to hide while waiting for stocks. They can generate meaningful returns on their own.
That does not mean stocks automatically need to decline. It means the bar gets higher. The market needs corporate earnings growth to compensate investors for assuming equity risk.
That is why I thought last week’s small retreat in the 10-year was actually meaningful. Moving from approximately 5.37% back toward 5.24% is not some dramatic change in the macro environment. But equities responded well to even that modest relief while equities went higher.
To me, that suggests the market still wants to move higher. The bond market has simply been making that move more difficult.
The five-year picture helps put the current environment into perspective. Long-term rates have moved from extraordinarily low levels to more than 5%, yet the S&P’s forward valuation has remained remarkably resilient. Today, the index is trading around 19.1x forward earnings which is roughly its 10-year historical average and actually below its recent five-year average.
I don’t look at 19.1x and conclude that stocks are obviously cheap. They aren’t. But I also don’t look at that number and see the kind of valuation excess that, by itself, requires a major market reset.
The bigger issue is what sits beside that valuation.
A 19x multiple when the 10-year yields 2% is one thing. A 19x multiple when the 10-year yields more than 5% is something very different.
That is why the next variable matters so much. Earnings.
2. Earnings Are Now Carrying More of the Market
One of the easiest narratives to repeat right now is that stocks are expensive.
There is some truth to that, especially in parts of technology and speculative growth. But valuation without earnings context only tells part of the story.
Corporate earnings have been incredibly strong.
Heading into the third-quarter reporting season, S&P 500 earnings growth is expected to exceed 35%. Strong earnings revisions have been one of the biggest reasons the market has been able to absorb the rise in interest rates without experiencing significant multiple compression.
This is where the relationship between rates and earnings becomes especially interesting.
At approximately 19.1x forward earnings, the S&P’s forward earnings yield is roughly 5.24%. The 10-year Treasury is also sitting around 5.24%.
I would not treat that as a complete valuation model. A Treasury security and an ownership stake in hundreds of businesses are very different assets. Stocks have growth, dividends, pricing power and the ability to compound earnings over time.
But the comparison illustrates the current environment perfectly.
If an investor can earn more than 5% in Treasuries, why accept the uncertainty of equities?
The answer has to be growth.
Corporate earnings have to keep increasing.
If earnings continue moving higher, the market can rise without requiring the valuation multiple to become dramatically more expensive. A higher S&P price accompanied by higher forward earnings can leave the actual P/E ratio relatively stable.
That is probably the cleanest path to another leg higher.
Not investors suddenly deciding that 22x or 24x earnings is acceptable with a 5% Treasury yield.
Instead, earnings estimates continue climbing and eventually catch up with price.
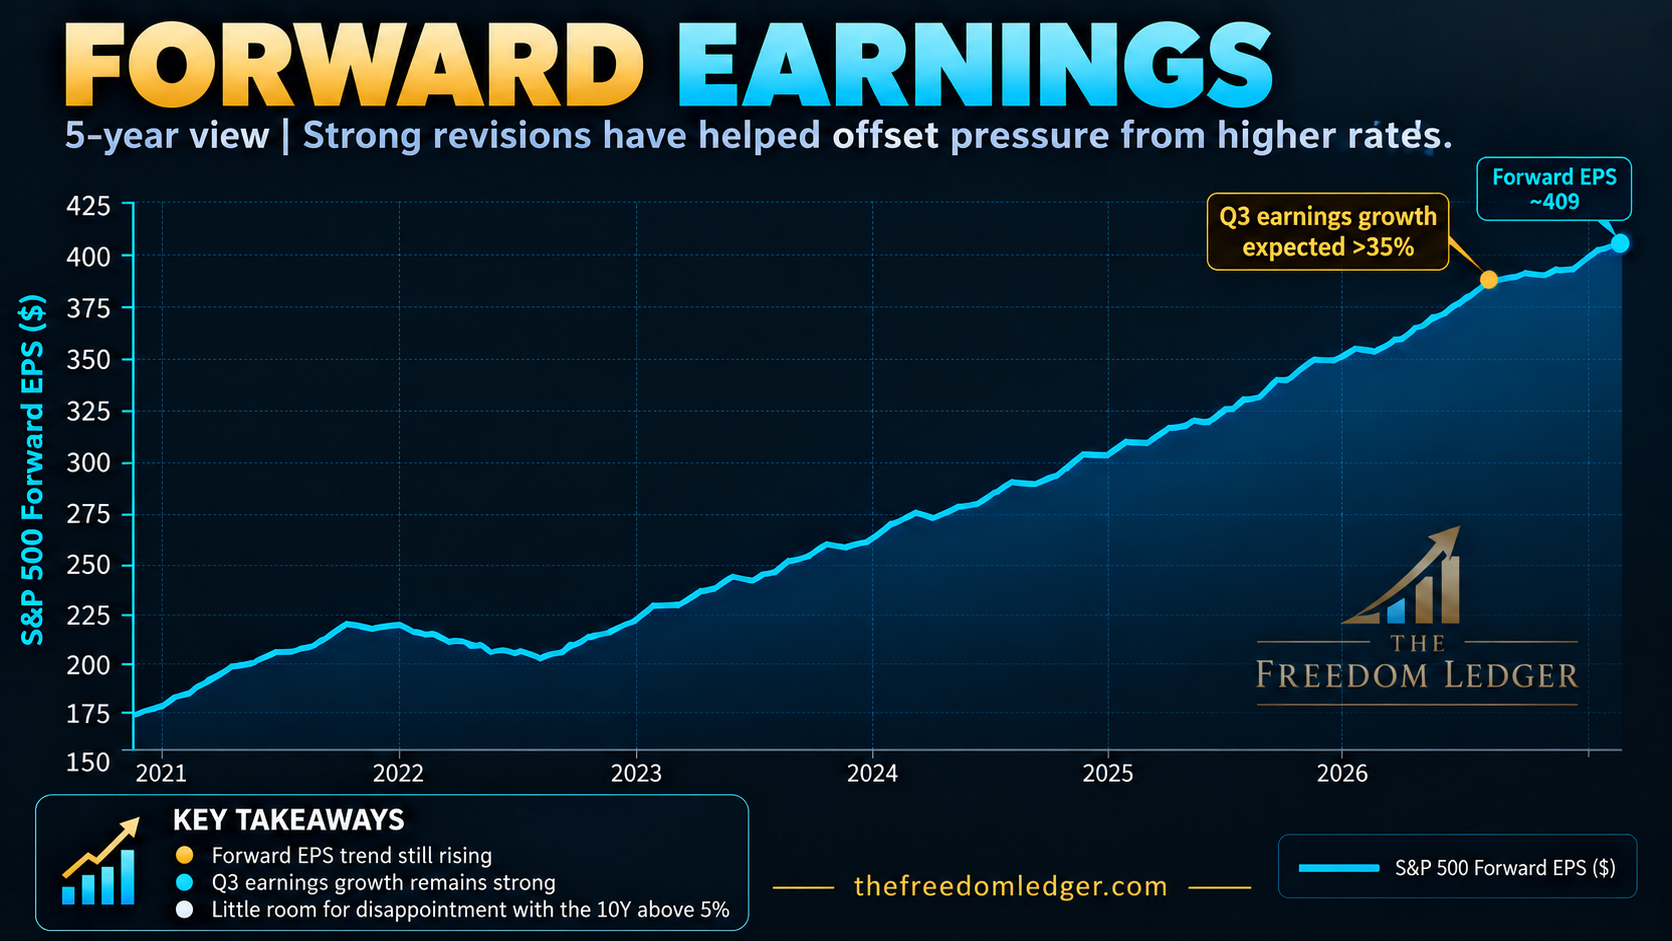
That is the second chart I would pay very close attention to over the next few months.
I care less about whether a company beats the quarterly consensus estimate by three cents than I do about what happens to the next four quarters of expectations after the earnings call.
Are analysts raising estimates?
Are margins expanding?
Is revenue growth accelerating?
Is management increasing guidance?
Is capital spending producing measurable returns?
Those are the things that can keep the forward earnings curve moving higher.
The danger is the opposite scenario.
If forward earnings estimates begin rolling over while the 10-year stays above 5%, the market suddenly has far less support. At that point you could have both parts of the valuation equation working against equities: weaker expected earnings and an attractive risk-free alternative competing for capital.
That is why this earnings season feels more consequential than the average one.
The market has handled higher rates remarkably well.
Now companies have to prove why.
3. The Next Few Weeks Should Tell Us a Lot
The timing makes this particularly interesting because we are entering one of the most important stretches of earnings and macro data of the quarter.
Major banks begin reporting this week, including JPMorgan, Goldman Sachs and Wells Fargo, followed by Bank of America and Morgan Stanley. ASML reports Wednesday, and Taiwan Semiconductor follows Thursday. At the same time, we get CPI Wednesday and PPI, retail sales and jobless claims Thursday.
That gives us several different windows into the economy at almost exactly the same time.
For the banks, I’m interested in much more than whether they beat earnings expectations.
Higher long-term rates are complicated for financial companies. Depending on the structure of the balance sheet, higher yields can support net interest income. So I don’t think the simple takeaway is that higher rates equal bad bank earnings.
What matters more is what those rates are beginning to do underneath the surface.
I want to hear about credit quality. Consumer delinquencies. Loan demand. Deposit and funding costs. Commercial lending. Any deterioration in the willingness or ability of consumers and businesses to borrow.
Those bank reports should provide one of our best real-time checks on whether restrictive financial conditions are beginning to cause meaningful damage.
Then there is technology.
The AI investment cycle has become one of the primary earnings engines of this market. Semiconductors, networking equipment, power infrastructure, data centers and industrial equipment have all benefited from an enormous capital expenditure cycle.
That spending has supported earnings and justified premium valuations across a meaningful portion of the S&P and Nasdaq.
But higher financing costs make the next part of the cycle more important.
Eventually, the conversation has to move beyond how much money is being spent on AI.
The question becomes what companies are earning from it.
That makes reports from companies such as ASML and TSMC particularly valuable. Their outlooks can tell us whether advanced-node demand remains strong, whether semiconductor capital expenditure continues accelerating and whether the infrastructure buildout supporting AI is still progressing at a pace consistent with the earnings assumptions already embedded in the market.
If banks tell us the economy and consumer are still holding up, technology tells us the investment cycle remains strong, and forward estimates continue moving higher, the market could have a very good setup.
Especially if the 10-year simply stops going up.
That is really the important distinction.
I’m not looking for everything to become perfect.
I’m looking for the pressure to stop getting worse while earnings continue getting better.
4. Constructive, But Still Selective
My own view has become a little more constructive, but I’m not suddenly interested in chasing everything higher.
There are some encouraging signs.
The S&P continues to hold near its highs. Earnings remain strong. Equal-weight participation improved last week for the first time after a long stretch of weakness. The technical structure of the broader index still looks capable of supporting another leg higher.
But there are also clear reasons to remain selective.
The Russell 2000 declined last week even as the major large-cap indexes advanced, so I don’t think we have confirmation of a healthy broad-market expansion yet.
The 10-year is still above 5%.
Oil remains elevated.
Real yields are restrictive.
And the market is already assuming a lot of things continue going right.
Corporate earnings need to remain strong. Inflation needs to remain manageable enough that the Fed does not have to become materially more restrictive. Long-term Treasury yields need to stabilize rather than march toward 6%. Oil cannot create another sustained inflation shock. And the enormous amount of capital being deployed into AI ultimately needs to generate acceptable economic returns.
None of those assumptions is unreasonable individually.
Together, they leave less room for error.
That is why I’ve been comfortable carrying more cash, being selective with new equity exposure and focusing my options selling on prices where I would genuinely be comfortable owning the underlying stock.
There is very little benefit in forcing exposure simply because the index is near a high.
If earnings continue confirming the story, there will be opportunities.
If they don’t, having liquidity becomes much more valuable.
The next several weeks should help resolve some of that uncertainty.
If the 10-year stabilizes somewhere around current levels or begins moving lower while forward earnings estimates continue climbing, I think the probability of another meaningful leg higher in the S&P increases substantially.
If yields begin moving materially higher again and earnings revisions begin weakening at the same time, that would change my view very quickly.
The market has already proven that it can survive higher rates.
The next question is whether earnings can keep giving it a reason to. We will have to wait and see 🤔
October 1, 2026
The Number Is Not the Whole Story
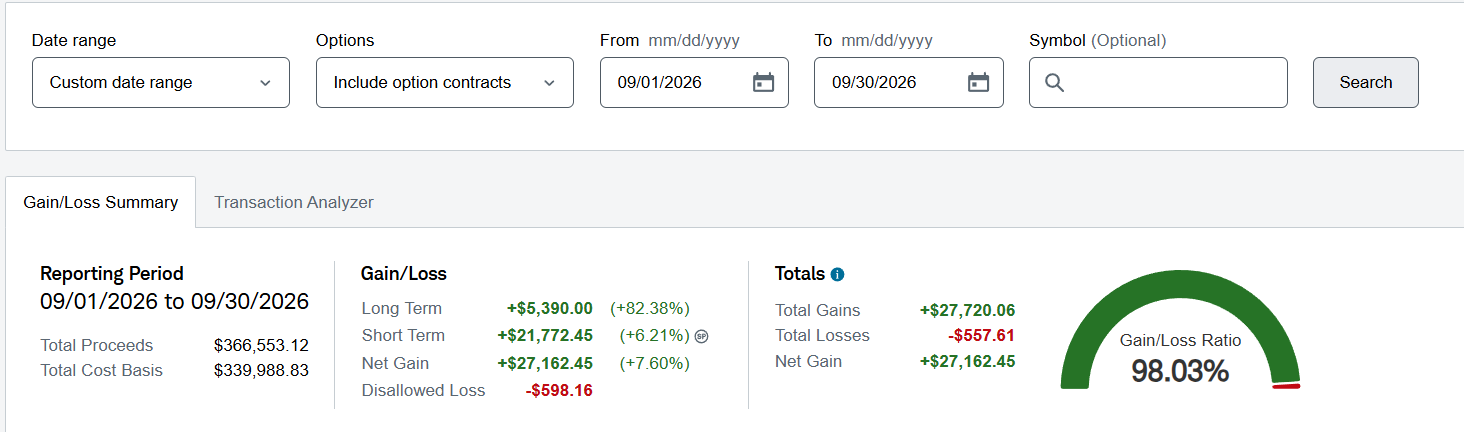
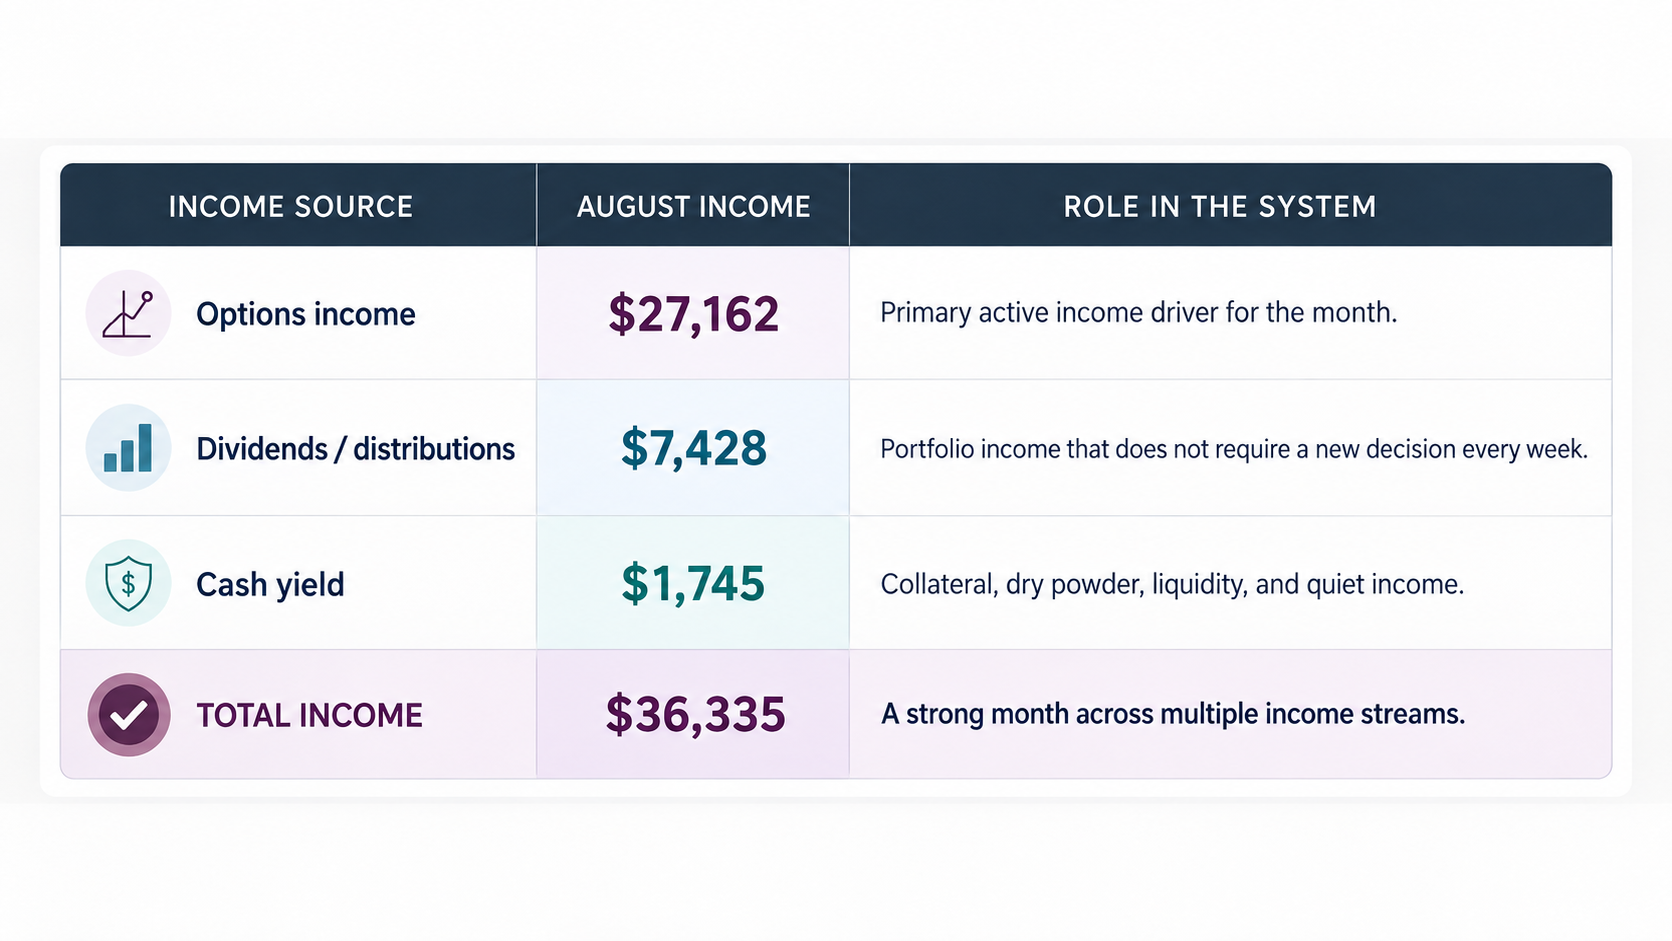
I locked in what felt a strong number again this month.
On the surface, that sounds great. And to be clear, I’m grateful for it. That is real income. It compounds. It creates options.
But the more important part of this month was not the number. The more important part was the context behind the number.
Because somehow, even after locking in that much income, I still felt like I was underperforming. That sounds strange, but it is exactly why investing and trading can mess with your head.
You can have a great month in absolute dollars and still feel behind because someone else is posting a bigger screenshot, a better return, or a massive win in the exact stock you did not own enough of.
That is why I wanted to write this. This is in now way shape a victory lap. It’s simply a reminder that A big number without risk context is almost meaningless.
Where the Options Income Came From
Most of the options income this month did not come from dozens of small trades. It came from a few larger winners that had been building for a while.
The first bucket was $TGT and $UNH.
Both of these were swing positions where I had been buying dips on pullbacks since 2025 and selling calls against the shares along the way. As they recovered, I started peeling pieces off instead of trying to perfectly time the top.
That is an important distinction. I was not trying to make one perfect trade. I was using the positions as part of a broader income system:
Buy weakness when the risk/reward makes sense.
Sell calls against the position.
Let the recovery work.
Take profits in pieces.
Keep reducing risk as the trade matures.
The second bucket was the $QQQ naked strangle.
This has continued to be one of the more consistent income drivers month after month. It is not exciting, and it is definitely not risk-free, but it has been repeatable when managed correctly.
The key with $QQQ is not pretending the index cannot move against me. It can. The key is sizing, strike selection, expiration selection, and being willing to adjust or close early when the trade has done its job.
That has been one of the biggest shifts in my options process over time. I care less about squeezing every dollar out of a position and more about whether the trade is still worth the risk.
The third bucket was selling puts on names like $BE, $SPCX, and $SMH.
Those trades added meaningful income, but I view them differently than the $QQQ premium or covered-call income on positions I already own. They are more opportunity-driven. When the setup, premium, support level, and risk/reward line up, I will take the trade.
The goal is not just to collect premium. The goal is to understand where the premium came from, why it was available, and what risk I was taking to earn it.
Yes, this month, the income was strong. But the bigger takeaway is that most of it came from a few areas I understood well.
A Tough Year Hidden Under Big Screenshots
One of the most useful things I saw recently was the U.S. Investing Championship standings.
The takeaway was simple: Even among very good traders and money managers, 2026 has not been an easy year.
The screenshot showed mostly modest gains across the verified stock division. Some managers were doing well, but very few were dramatically outperforming. And based on the post I saw, only a small number of non-levered participants were outperforming the Nasdaq year-to-date.
Why does that matter? Well, because if you spend enough time doom scrolling on X, it can feel like everyone is doubling their account, perfectly timing every semiconductor trade, and turning every pullback into a massive win.
That is not reality. Reality is much harder than that.
Unless you were heavily positioned in the right pockets of the market… names like $INTC, $AMD, $MU, $SNDK, or some of the strongest AI, chip, and memory trades, the odds of dramatically outperforming have not been great.
And even then, a lot of that outperformance required concentration, timing, and risk.
I was fortunate to be heavily involved in $INTC, but I do not want to pretend that was some perfect discretionary call.
A lot of that came from the data. The options flow, positioning, and repeated institutional activity kept pointing me toward where capital was moving. This is why I’m always following options flow.
That helped. But that does not make this easy..
Why I Still Felt Like I Was Underperforming
This month looked strong from the outside. But I also know I played this year far more defensively than last year.
More cash.
Wider strikes.
Less leverage.
Fewer forced trades.
Less willingness to chase.
More willingness to close early when the market turns.
That has helped me manage risk. It has also reduced my upside by A LOT!
That is the tradeoff. And it is one I am comfortable making right now.
There are environments where it makes sense to press. There are environments where it makes sense to size up. There are environments where the market gives you clean opportunities with favorable risk/reward.
This has not felt like one of those years. I’ve had plenty of losses, including 30 short contracts of $MSTR I rolled four times down and out and eventually took a $17k loss on before it came back last month🙁
Listen…The indexes are still hanging in there.
AI remains dominant, but crowded.
Capex questions and now with rising interest rates becoming a serious concern.
Geopolitical risk has not disappeared.
Valuations are not cheap.
And a lot of the market’s strength has been concentrated in specific pockets.
That does not mean I am bearish. It means I am trying to stay optimistically skeptical.
The Screenshot Problem
This is the part I think more people need to hear. A screenshot does not show the whole book.
You usually do not see:
The capital required.
The leverage used.
The open losses.
The drawdowns.
The margin exposure.
The concentration risk.
The stress it takes to hold through a losing position
The positions that have not been closed yet.
The downside if the macro picture changes quickly.
That is why comparing your results to someone else’s screenshot is dangerous. Someone can post a $50,000 win and still be carrying $300,000 of hidden risk.
Someone can post a 20% month and be one bad gap away from giving most of it back. Someone can look like a genius during a narrow momentum run and then disappear when the trade unwinds.
That does not mean everyone posting big numbers is fake. Some people really are crushing it.
But as a reader, you have to understand that the number alone does not tell you enough.
The better questions are:
How much capital was used?
How much risk was taken?
Was leverage involved?
Was the trade repeatable?
What happens if the position moves against them?
Could they survive a bad month?
Is this income, speculation, or both?
I don’t know about you, but, I’m here to play the long game.
So…What The Heck Am I Watching Into the Final Quarter
As we move into the final quarter of the year, I am changing how I’m thinking about risk.
A lot of my favorite macro and market commentators keep describing this cycle as somewhere in the sixth, seventh, or eighth inning. Maybe that is right. Maybe it is still early. Maybe the market keeps climbing longer than anyone expects.
I do not know. But the data is getting harder to ignore.
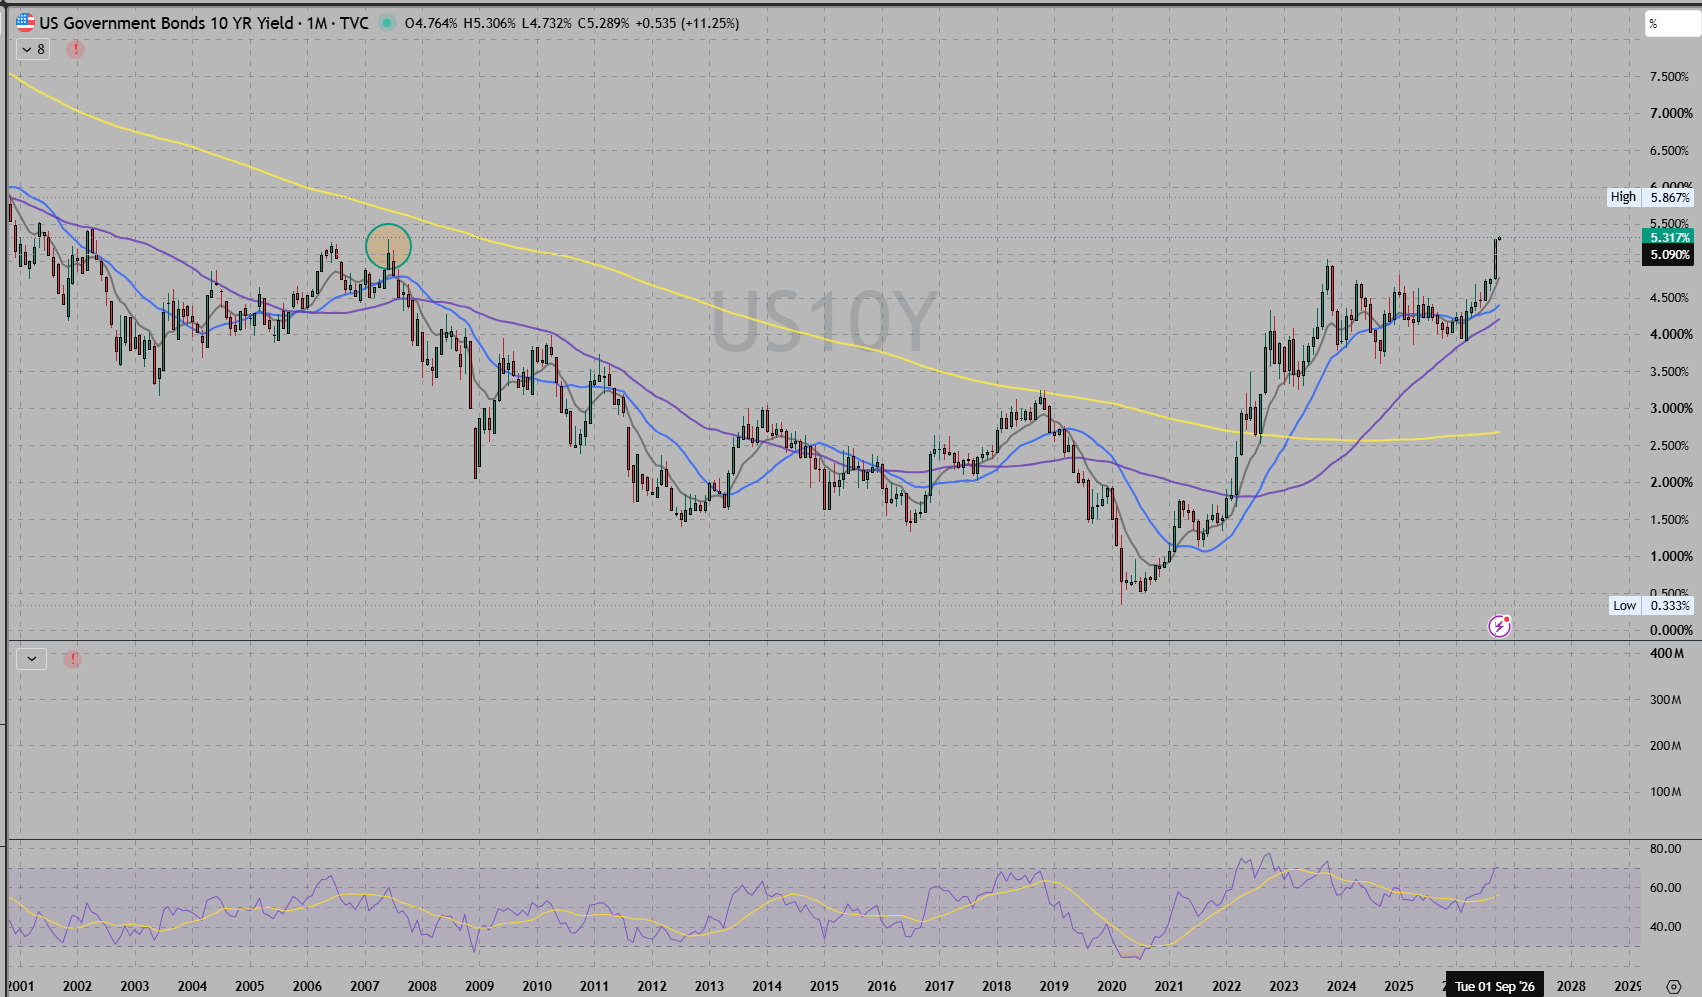
The 10-year Treasury yield has pushed to its highest level since 2002, with Reuters reporting that it reached roughly 5.34% during the most recent bond selloff. The 10-year yield is one of the most important benchmarks in the world. It affects mortgages, corporate borrowing, discount rates, equity valuations, and the attractiveness of cash and bonds relative to stocks. Reuters
Normally, when yields are moving like this, you would expect more pressure on equities. And yet, somehow, the market is still not far from all-time highs.
That is the part that makes this environment so difficult.
On one hand, earnings have held up. AI spending is still driving real revenue for certain companies. Mega-cap technology has continued to support the index. Momentum can keep going longer than people expect.
On the other hand, higher yields change the math. Not to mention, we’re still talking about additional hikes this year.
When cash can earn a meaningful return and bonds are offering yields we have not seen in decades, the hurdle rate for stocks should be higher. Future earnings should be discounted more aggressively. Expensive growth names should have less room for error. And companies funding massive AI infrastructure buildouts through continued capex now have to justify that spending in a more expensive cost-of-capital environment.
That is why capex is becoming one of the biggest questions in the market. The market is still rewarding AI infrastructure, chips, data centers, and everything attached to the theme. Trust me….I LOVE AI. It’s enhanced my life in the best of ways. But at these yield levels, investors are going to care more about whether that spending actually converts into earnings, cash flow, and durable returns.
The story is no longer just: “AI is the future.” I don’t care how quick Chat GPT can diagnose my dog’s medical scare at midnight.
The next question is: “What return are companies actually earning on all this spending?”
That is a different market. And it is one where I want to be more careful.
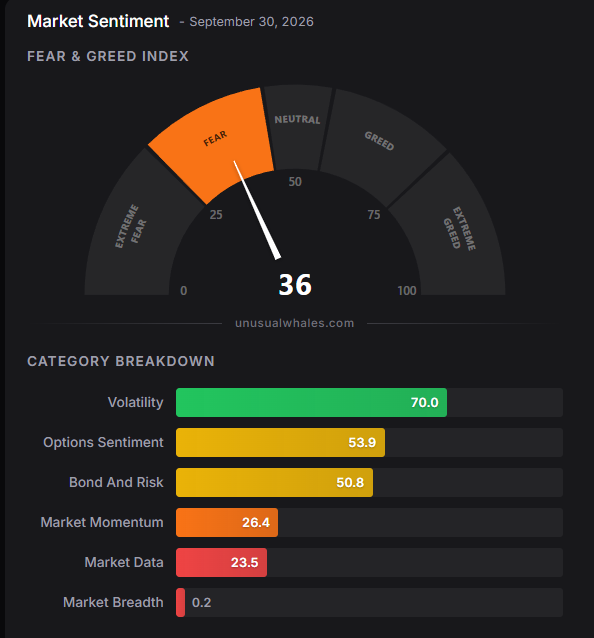
One of the bigger concerns right now is market breadth.
The indexes still look fine on the surface, but underneath, participation has weakened dramatically. Goldman Sachs reportedly noted this week that strength in AI-related stocks has helped keep the S&P 500 relatively steady, even as market breadth has deteriorated to its weakest level since the dot-com bubble. The median S&P 500 stock is reportedly trading about 16% below its own 52-week high, even while the index remains near record levels. Investing.com
That is a strange market. It gets even stranger when you layer in rates.
As I mentioned above, the 10-year Treasury yield has pushed to roughly the highest level in 24 years. Normally, when the risk-free rate rises that much, you would expect more pressure on equities. Higher yields compete with stocks, pressure valuation multiples, raise the discount rate on future earnings, and make cash and bonds more attractive alternatives. Yet the major indexes have not fully cracked.
The market can look strong at the index level while the average stock is already struggling. The S&P 500 can sit near highs while breadth deteriorates. A handful of large companies can offset weakness underneath the surface for longer than people expect. But that does not mean the market is healthy. It means the leadership is narrow.
The equal-weight S&P 500 has also lagged the cap-weighted index, reinforcing the same point: the largest names are doing more of the heavy lifting, while the broader market is not participating the same way. Barron’s noted that the cap-weighted S&P 500 was on pace for its largest outperformance of the equal-weight version since March 2020. Barron's
If yields are at multi-decade highs and breadth is this weak, I do not want to pretend everything is fine just because the index chart still looks okay. At the same time, I do not want to be blindly bearish when earnings from the AI and mega-cap leaders are still strong enough to support the market.
That is why I keep coming back to the same phrase: Optimistically skeptical.
The Final Quarter Playbook
So heading into the last quarter of the year, my plan is simple:
Stay invested, but not fully exposed.
Hold more cash than usual.
Let cash earn yield via $SWVXX which allows me to collect premium and the funds sell options.
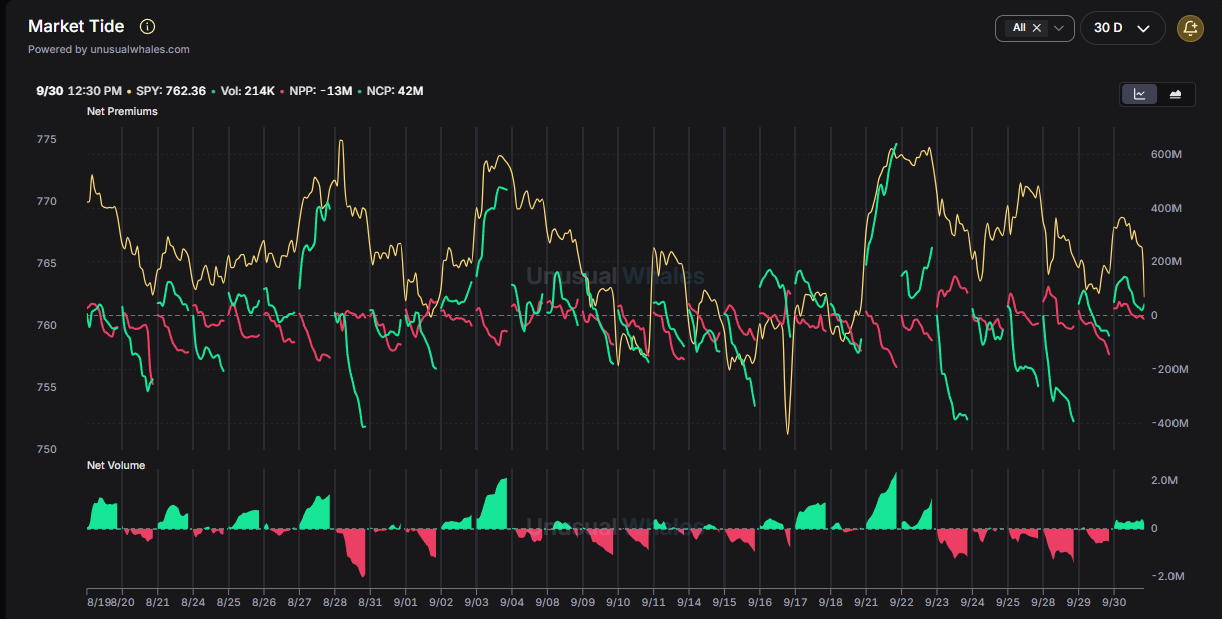
Avoid chasing extended names that do not have the options flow to back it up.
Trim positions that have become oversized or extended.
Wait for volatility to improve before selling more aggressive premium.
Focus on quality, liquidity, and strikes I am willing to manage.
Do not let comparison on X, Discords, or anywhere for that matter to force unnecessary risk.
If the market keeps going higher, I will participate. If the market finally corrects, I will have cash ready. If volatility expands, I can sell premium in better conditions.
That is the balance I want. Not bearish. Not reckless. Just realistic.
At this point in the cycle, with yields at multi-decade highs, breadth deteriorating, AI capex under more scrutiny, and the indexes still sitting near highs, I would rather protect optionality than chase every last dollar.
I have spent too many years building this portfolio to pretend risk does not matter.
And if that means I underperform to my own incredibly high expectations, I can live with that.
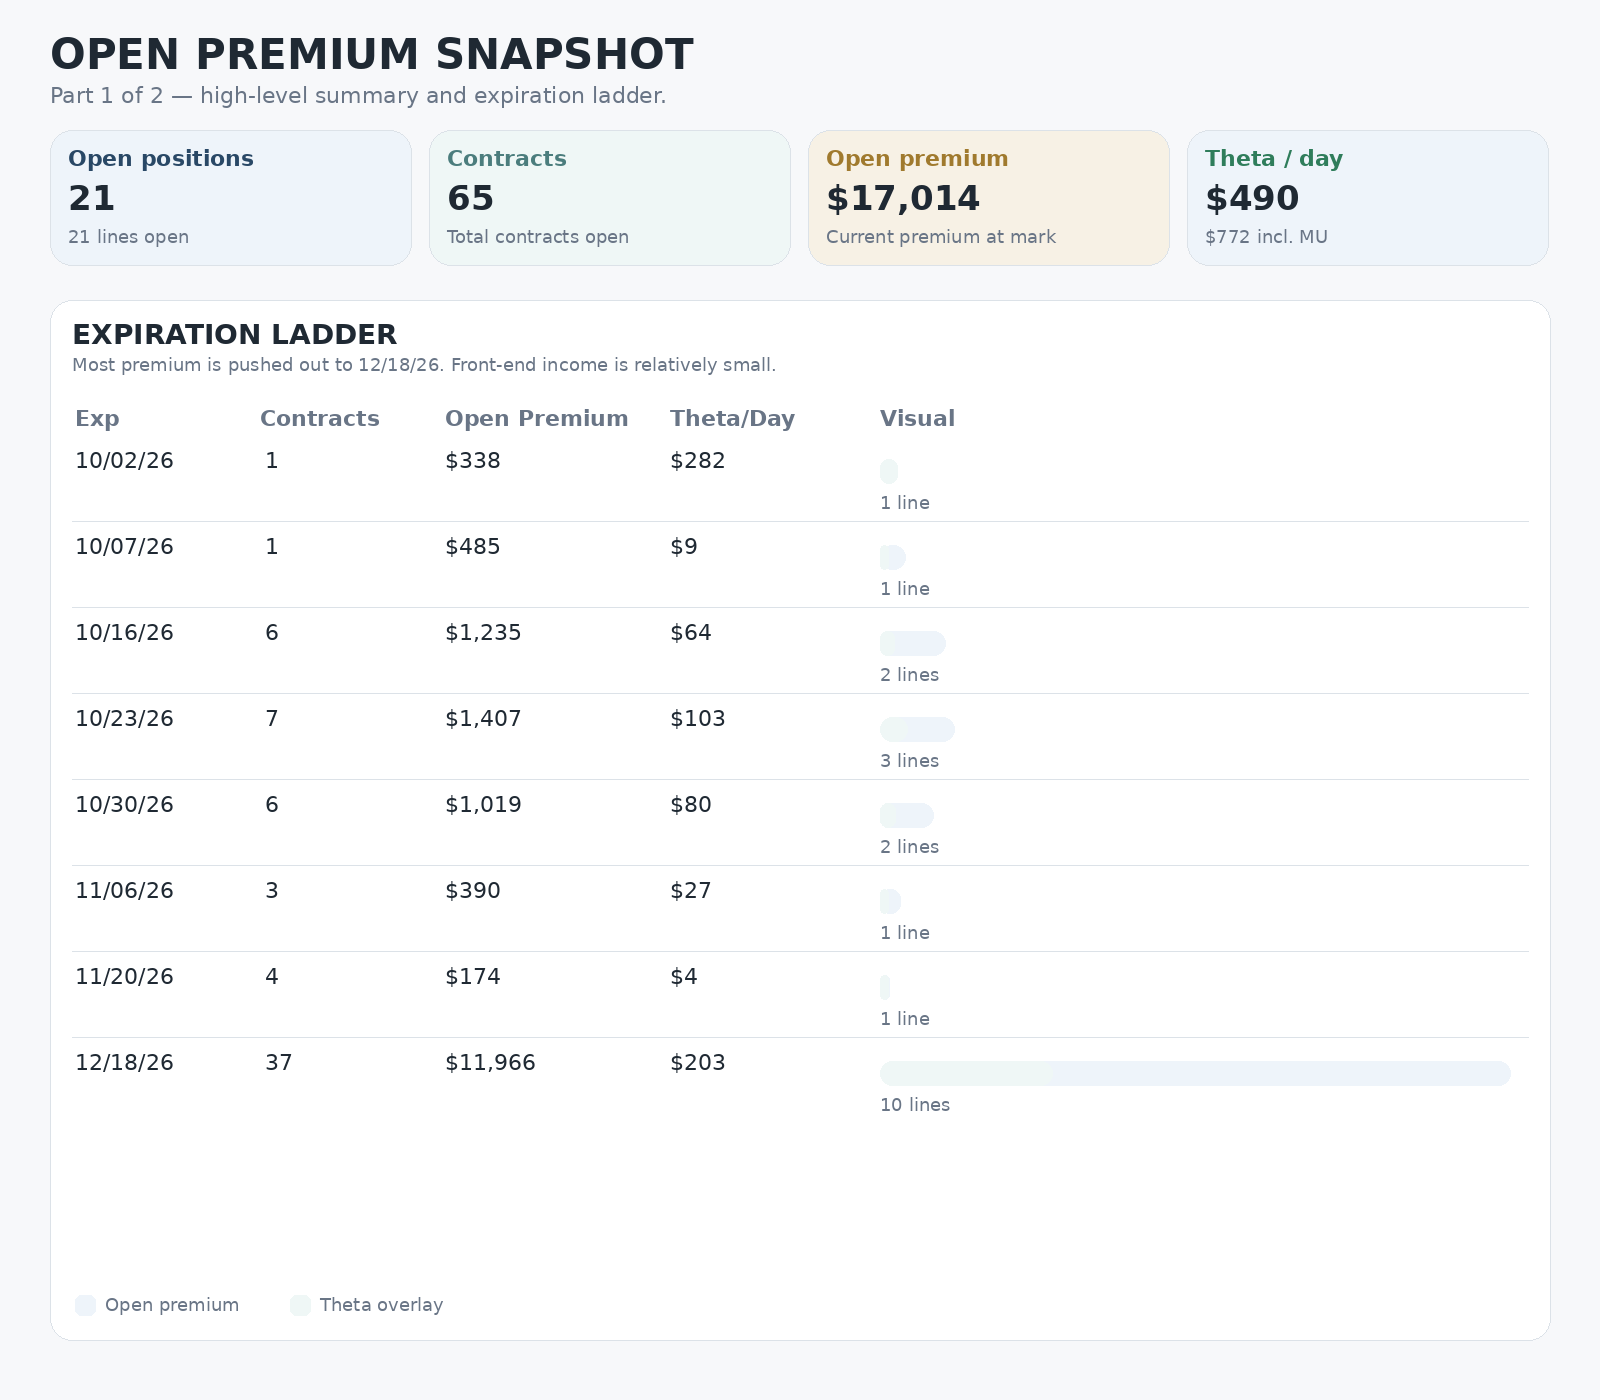
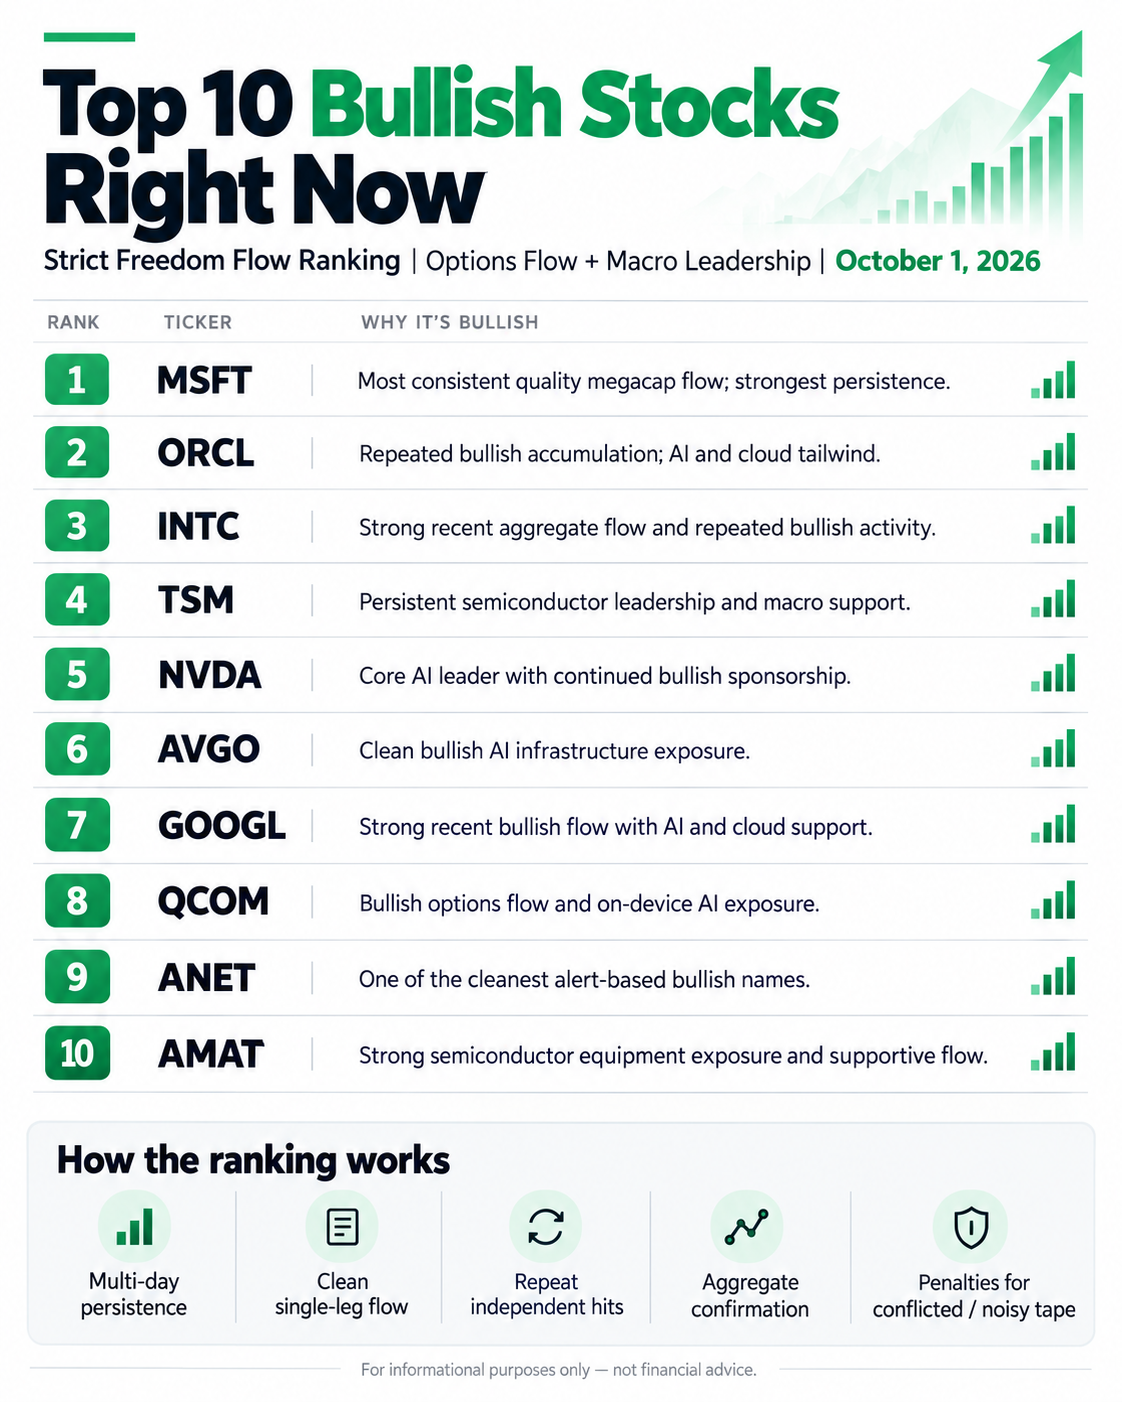
Finally, below is what I currently have open in the book right now…you can see I’ve trimmed this down significantly. I’ve also consolidated over the last 30 days the most bullish stocks based on the current options flow and updated ranking system.
As always, I wish everyone a great and successful October!